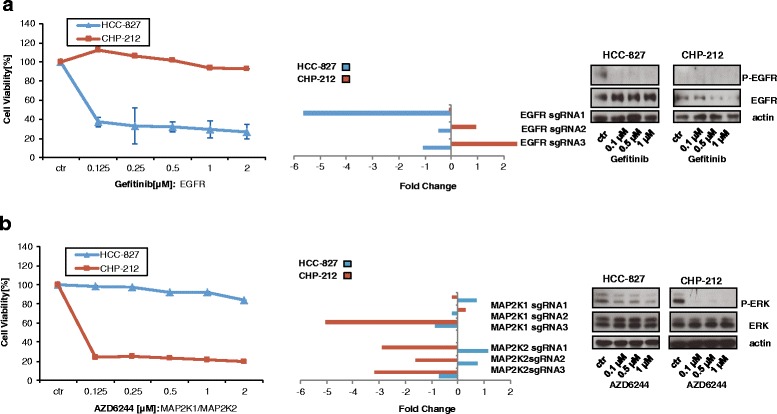
Fig. 3.

Depletion of kinases EGFR and MAP2K1 correlates with sensitivity towards EGFR and MEK inhibitors. a left panel: HCC-827 and CHP-212 cells were treated with indicated concentrations of Gefitinib for 72 h. Then, cell viability was measured by Cell Titer Glo according to the manufacturer’s instructions. Middle panel: Fold change for the three independent sgRNAs for EGFR from the screen are depicted at time point day 14. Right panel: HCC-827 and CHP-212 cells were treated for 2 h with the indicated concentrations of Gefitinib. Then, cells were lysed and analysed by Western blot. b same as a) but the MEK inhibitor AZD6244 was used instead (left panel) and fold change for sgRNAs for MAP2K1 and MAP2K3 from the screen are depicted (middle panel). Right panel: HCC-827 and CHP-212 cells were treated for 2 h with the indicated concentrations of AZD6244. Then, cells were lysed and analysed by Western blot
