
Fig. 4.
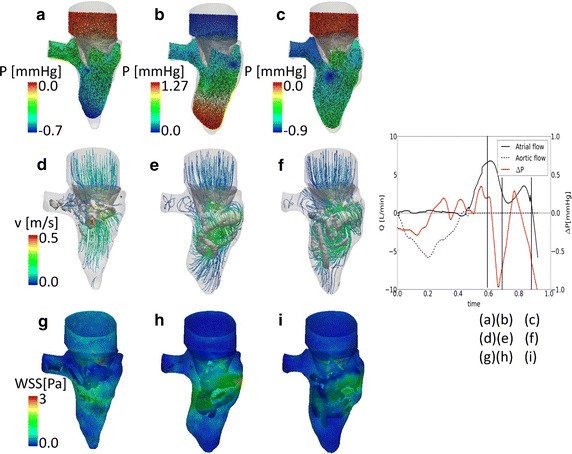
Diastolic flow field. Pressure and velocity vectors in the LV (a–c) on a section. Streamlines and vortex structure (λ2) (d–f). WSS at the walls (g–i). j Flow curve and the intraventricular pressure difference (base–apex) during the cardiac cycle. The time-points used in a–i are indicated. Please note that the color scale for the pressure difference changes in each panel