
Fig. 5.
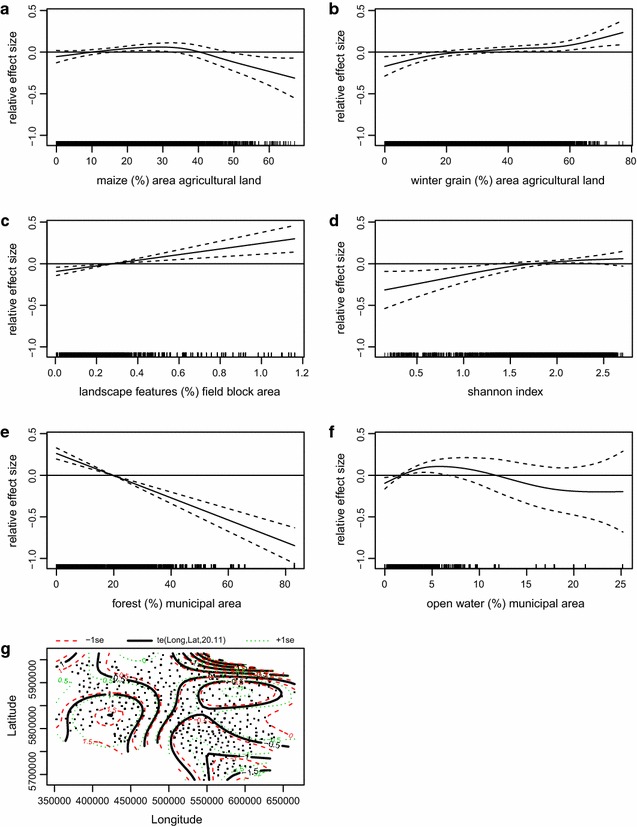
Minimum adequate habitat model of the common pheasant hens. Figure displays results of GAMM showing significant smoothers: a % maize/agricultural area, b % winter grains /agricultural area, c % landscape features/field block area, d Shannon Index, e % forest/municipal area, f % open water/municipal area, g longitude × latitude. R2 adjusted = 0.82