Fig. 2.

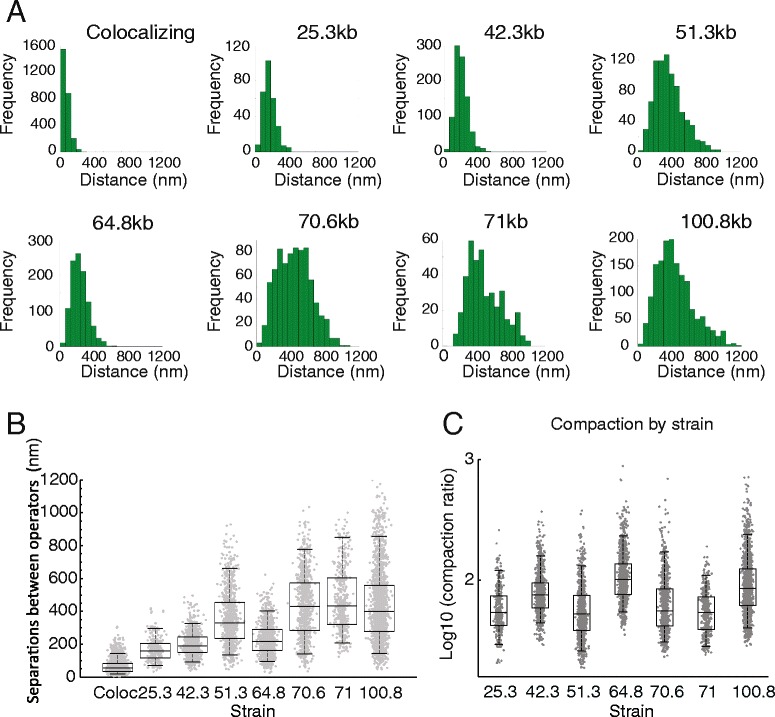
Relationship between genomic separation and physical distance. a Frequency distributions of spot distances for the genomic separations indicated. Bin sizes are based on mean measurement error (63 nm). b Box plots representing spot distances for measurements from each strain. c Compaction ratio defined as 0.34α/d, where α is the genomic separation (in base pairs) and d is the measured distance (in nm)
