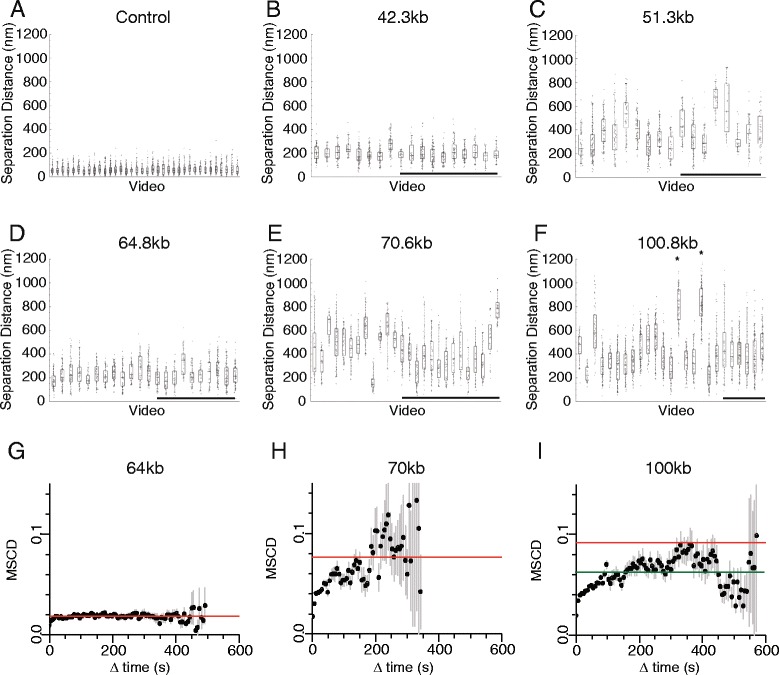
Fig. 5.

Variations in the motion of reporter loci in single cells. a–f Box plots of distances for individual cells. Non-underlined boxes indicate data collected from videos of approximately one minute in length during which Z stacks were collected approximately once per second. Underlined boxes were collected over 10 min with each Z stack collected at 6 s intervals. Variation in median distance between cells is observed, especially for the 51, 70 and 100 kb separations, in some cases over durations of up to 10 min. The the mean square change in distance (MSCD) as a function of the time interval was calculated for the 64, 70 and 100 kb strains where distance was sufficiently distinct from the 63 nm measurement error (g-i). To extend the range of time intervals that could be used, data from videos in which distance was measured at short intervals and at longer intervals were superposed and binned in 6 s time intervals. Error bars represent standard error. In each case a trend is observed for MSCD to increase reaching a plateau after 30–150 s. The red line shows the MSCD calculated by bootstrapping across random time points from random videos for a given strain (a cell-independent and time-independent estimate). The green line (in panel i) shows the same quantity found excluding data from two videos with unusually large distances (marked with asterisks in panel f). These observations suggest that over longer time intervals, the MSCD observed within cells approaches that observed between cells
