Fig. 7.

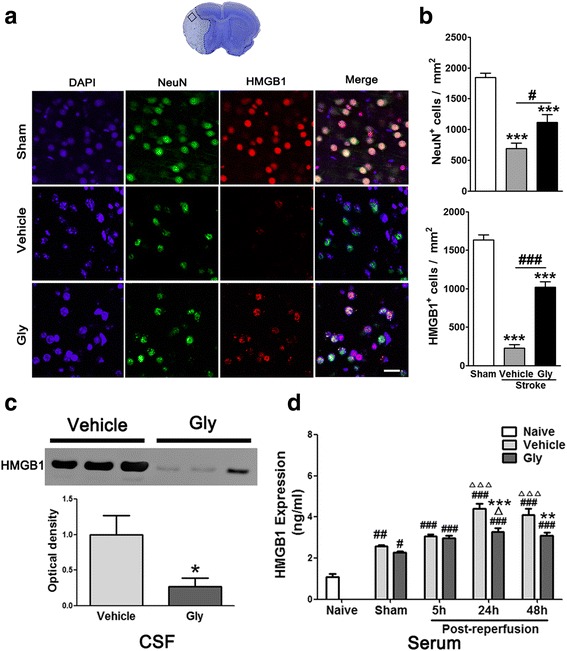
Gly inhibits HMGB1 release in ischemic area and HMGB1 expression in CSF and serum. a Representative imaging of double immunofluorescent labeling for HMGB1 with NeuN in the ischemic brain at 3 days after stroke. The top image shows a representative coronal brain section with cresyl violet staining, on which the square represents the area where pictures of immunostaining were taken. Scale bar = 50 μm. NeuN-positive cells are green, HMGB1-positive cells are red, and merged cells are yellow. b Bar graphs show the statistical results of NeuN- and HMGB1-positive cell numbers. ***P < 0.001 vs sham; # P < 0.05, ### P < 0.001, respectively, between the two indicated groups. n = 5/group. c Western blotting confirmed that HMGB1 release in the CSF was inhibited by Gly. Representative protein bands of HMGB1 are shown, and the bar graph shows statistical results. The drug was injected immediately before and 2 h post-reperfusion after 100 min of MCA suture occlusion. CSF was collected 24 h later. No protein bands were detected in the samples from sham surgery (data not shown). *P < 0.05 vs vehicle. n = 5/group. d Gly injection inhibited HMGB1 release in the serum in rats with MCA suture occlusion. HMGB1 levels in serum after 5, 24, and 48 h of reperfusion were assessed by ELISA. # P < 0.05, ## P < 0.01, ### P < 0.001 vs naïve, respectively; Δ P < 0.05, ΔΔΔ P < 0.001 vs sham, respectively; **P < 0.05, ***P < 0.001 vs vehicle at the same time point, respectively
