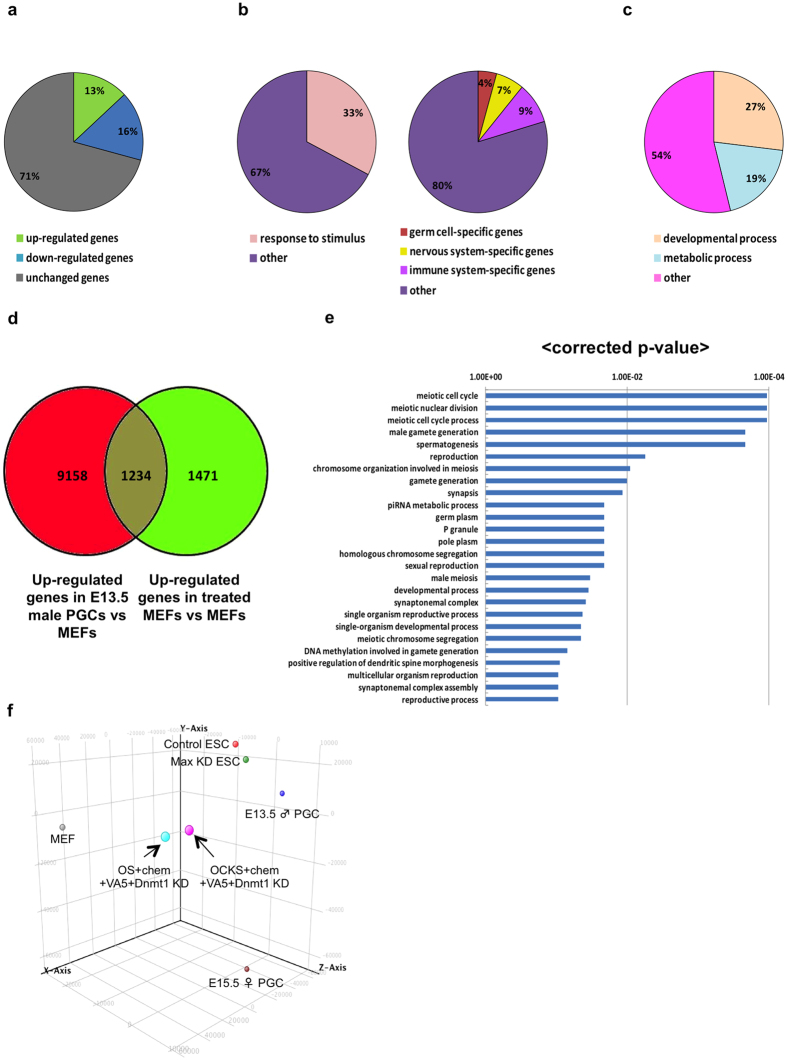
Figure 4. Transcriptome analysis of MEFs in OS + chem + VA5 + Dnmt1-KD condition.
(a) The ratios of number of upregulated or downregulated genes in MEFs 4 days after OS + chem + VA5 + Dnmt1-KD treatment compared with in control MEFs. Genes whose expression was changed at least two-fold (p < 0.001) were analyzed. (b) The ratios of upregulated genes annotated with particular GO terms. (c) The ratios of downregulated genes annotated with particular GO terms. (d) Relationship of upregulated genes in E13.5 male PGCs and in the treated MEFs compared with control MEFs. (e) GO analysis in commonly upregulated genes in E13.5 male PGCs and in the treated MEFs compared with control MEFs. The GO terms with corrected p-value under 0.05 are shown. (f) Principal Component Analysis (PCA) of control MEFs (MEF), MEFs with OS or OCKS + chem + VA5 + Dnmt1-KD treatments after 4 days in culture, E13.5 male (♂) PGCs, E15.5 female (♀) PGCs, control ESCs, and Max KD ESCs. X-Axis: Component 1 (46.49%), Y-Axis: Component 2 (26.37%), Z-Axis: Component 3 (11.12%). The array data obtained from three biological replicates.

