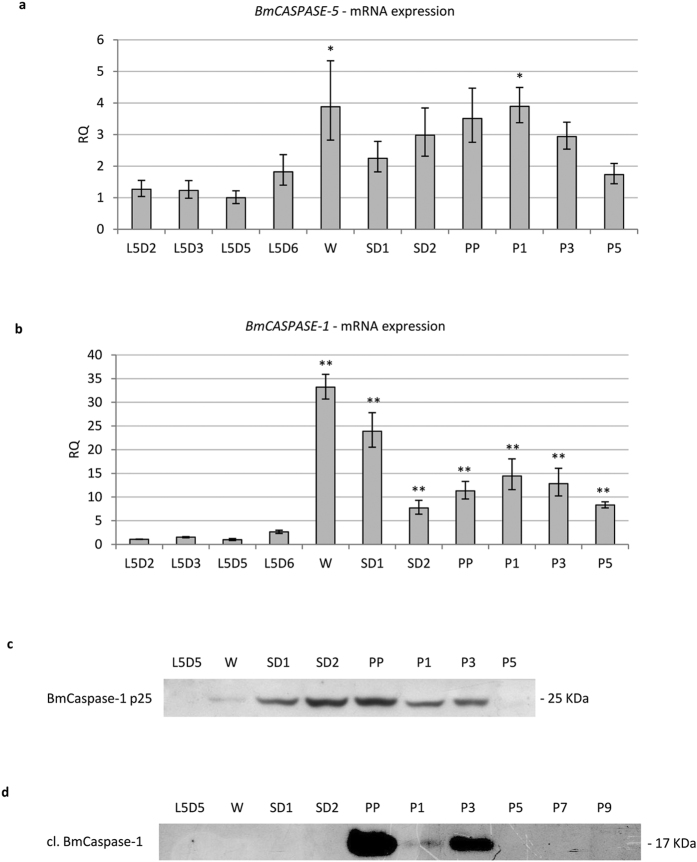
Figure 2. Apoptosis is activated after autophagy.
(a,b) qRT-PCR analysis of BmCASPASE-5 (a) and BmCASPASE-1 (b); (c,d) Western blot analysis of uncleaved (c) and cleaved (d) BmCaspase-1 during metamorphosis. Values represent mean ± s.e.m. (*p < 0.05; **p < 0.01 compared to L5D2 using ANOVA followed by Tukey’s HSD test).

