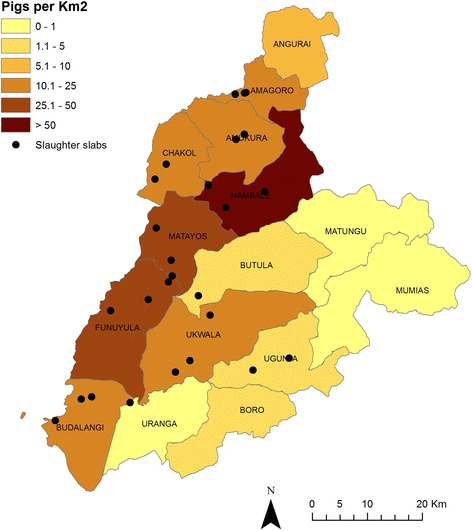
Fig. 1.

Map depicting study site showing divisional pig population density and location of registered porcine slaughter facilities at time of sampling. This map was produced using ArcMapTM version 9.1 with geographical data provided by ILRI GIS unit http://www.ilri.org/gis and pig population data provided by the District Livestock and Production Office 2009 figures and overlaid with the location of slaughter facilities collected in the field using a hand held Garmin® eTrex GPS unit
