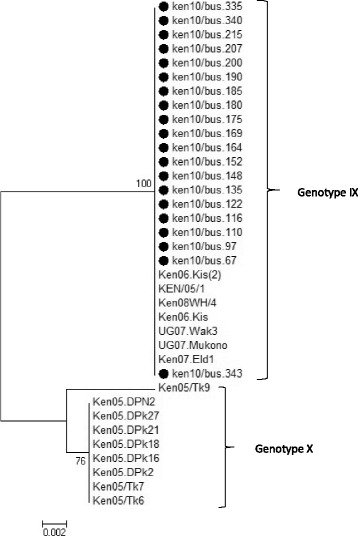
Fig. 3.

Phylogenetic tree based on the full length E183L gene.  Indicates the 20 sequences analyzed in this study that cluster within genotype IX in comparison to 16 reference sequences obtained from Genbank. The evolutionary history was inferred using the Minimum Evolution method after initial utilization of the Neighbor-joining algorithm. The percentage of replicate trees in which the associated taxa clustered together in the bootstrap test (1000 replicates) are shown next to the branches. The tree is drawn to scale, with branch lengths in the same units as those of the evolutionary distances used to infer the phylogenetic tree. The evolutionary distances were computed using the p-distance method and are in the units of the number of base differences per site. The ME tree was searched using the Close-Neighbour-Interchange (CNI) algorithm at a search level of 1
