
Fig. 8.
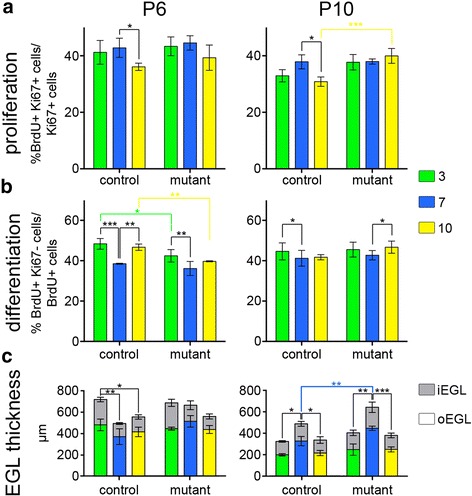
En1 +/− ;En2 −/− mutant gcp proliferation and differentiation are altered primarily in the anterior and nodular zones. The level of gc proliferation (a) and differentiation (b) were calculated as in Fig. 4c and d, respectively, at P6 and P10 in lobules 3 (AZ: green), 7 (CZ: blue) and 10 (NZ: 10) for En2 +/− control and En1 +/− ;En2 −/− mutant mice. p-values of the Dunnet’s post-hoc multiple comparisons tests following ANOVA comparing the levels of proliferation and differentiation between lobules at each time-point are shown when significant (see Additional file 1: Table S5A). c EGL thickness in μm is shown for the same lobules at P6 and P10 (n = 3 mice for each measurement). The outer EGL is represented in colors and the inner EGL in grey. p-values of Tukey’s (for lobule comparisons) and Sidak’s (for genotype comparisons) post-hoc multiple comparisons tests following ANOVA are shown when significant (See Additional file 1: Tables S6)