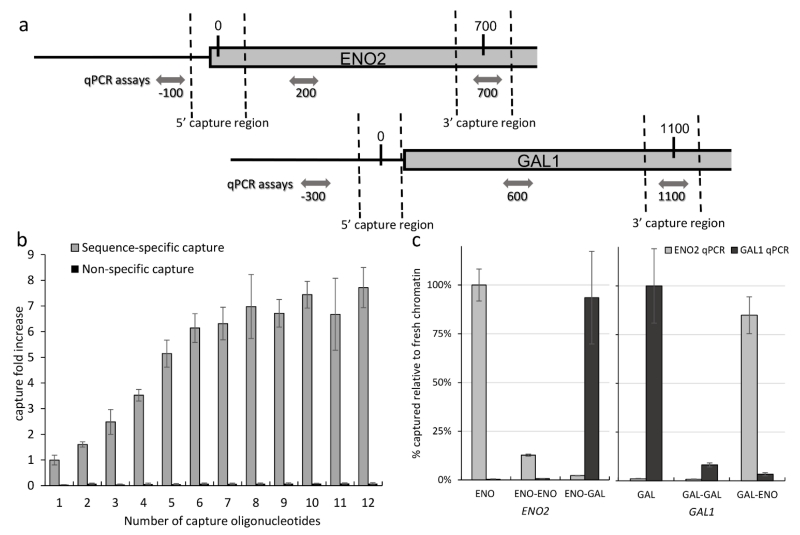
Figure 3.
Hybridization strategy. (a) Diagram depicting the target regions for ENO2 and GAL1 promoter regions. Target oligonucleotides are designed targeting both strands and both ends of the target regions. For each HyCCAPP target region, three qPCR assays were designed accounting for the size differences between the HyCCAPP process and the ChIP validations. Distances in base pairs from the middle of the 5′ capture region are shown. (b) Hybridization capture experiments were carried out with an increasing number of capture oligonucleotides without altering the total final concentration of capture oligonucleotides. The efficiency was measured through qPCR after reversing the crosslinking of the captured material. Fold increases were calculated relative to hybridization with one oligonucleotide. Depicted error bars represent the standard deviation. No significant change was observed in non-specific capture across all samples. (c) Subsequent captures using oligonucleotides targeting the ENO2 and GAL1 regions. Capture efficiency was measured through qPCR after reversing the crosslinking of the captured material. ENO and GAL refer to captures using fresh chromatin, while ENO-ENO/GAL and GAL-ENO/GAL, refer to captures using chromatin previously used for captures targeting the ENO2 and GAL1 regions, respectively.

