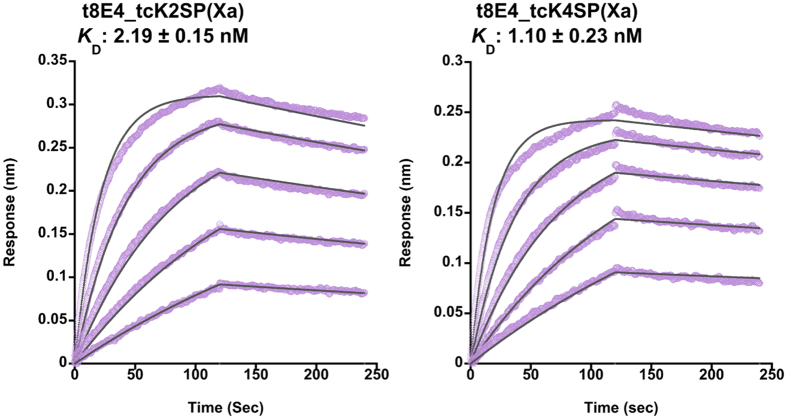
Figure 4. Determination of the binding affinities of t8E4 toward different truncated tcHGF proteins.
The sensorchip immobilized with the t8E4 antibody was incubated with five different concentrations (6.25, 12.5, 25, 50, and 100 nM) of tcK2SP(Xa) or tcK4SP(Xa) analytes. Actual binding curves (lavender) are overlaid with the fitting curves (thin black lines) used to derive the KD values. Experiments were repeated three times and the KD values are expressed as mean ± SD (n = 3) at the top.

