Fig. 1.

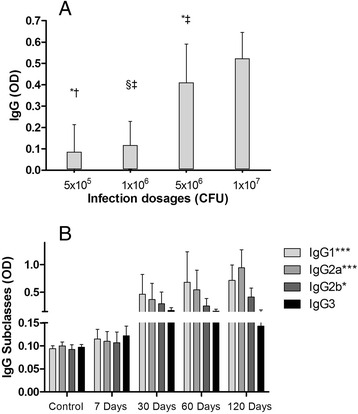
Serum IgG immune response in mice inoculated with T1 C. pseudotuberculosis strain, as evaluated by ELISA. Graph represents means of Optical Density (OD) values found for each group (n = 5 animals for group). Results are representative of the mean values obtained from two experiments. a. BALB/c mice were inoculated with increasing dosages: 5x10⁵, 1x10⁶, 5x10⁶ and 1x10⁷ CFU. Blood was collected 120 days after inoculation. Data were analyzed by ANOVA and Tukey post-hoc tests; *, †, ‡ and § indicate pairs with statistically significant differences. b. IgG subclass (IgG1, IgG2a, IgG2b and IgG3) production throughout the course of the experiment: control (before infection), 7, 30, 60, and 120 days after infection. Mice were inoculated with 107 CFU of T1 strain of C. pseudotuberculosis. Data were analyzed by ANOVA. *P < 0.05; ***P < 0.001
