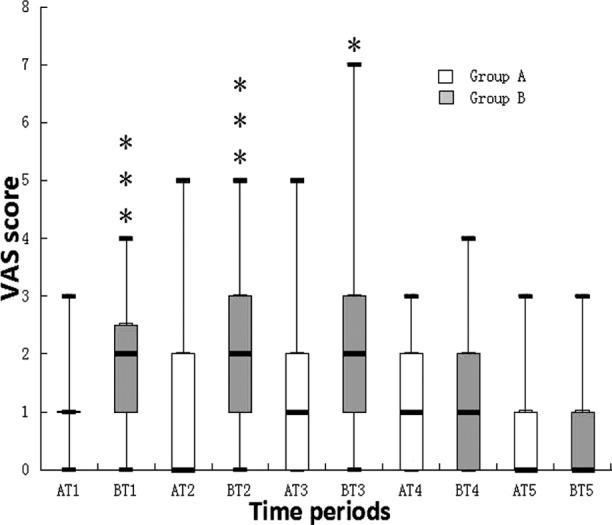
Fig.1.

Box plots of VAS scores at various time points. Results are expressed in median. The top and bottom of each box indicate 75th and 25th percentiles and the error bars minimum and maximum values.
Abbreviations: VAS, visual analogue scale; T1, during caudal block or periprostatic nerve block; T2, during introduction and presence of the probe in the rectum; T3, during biopsy procedure; T4, 30 minutes after the procedure and T5, a day after the procedure; Group-A, the caudal block group; Group-B, The intrarectal local anesthesia and periprostatic nerve block group. * indicates P<0.05, *** indicates P<0.001.
