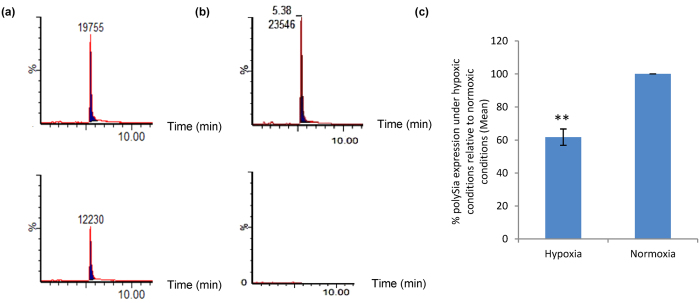
Figure 1. Effect of hypoxia (48 hours, 0.1% O2) on polySia expression in C6-STX cells.
(a) Mild acidic hydrolysis combined with UPLC/MS/MS analysis used to detect polySia in C6-STX cells under normoxia (upper trace) and hypoxia (lower trace, after 48 hours). Y-axis represents % abundance of polySia, x-axis represents time. (b) Elution standard for standard DMB-labelled sialic acid (upper trace) and negative control sample where no Endo-N was added as described in the material and methods section (lower trace). (c) Quantification of the mean polySia levels as determined by HPLC. (**P ≤ 0.01).

