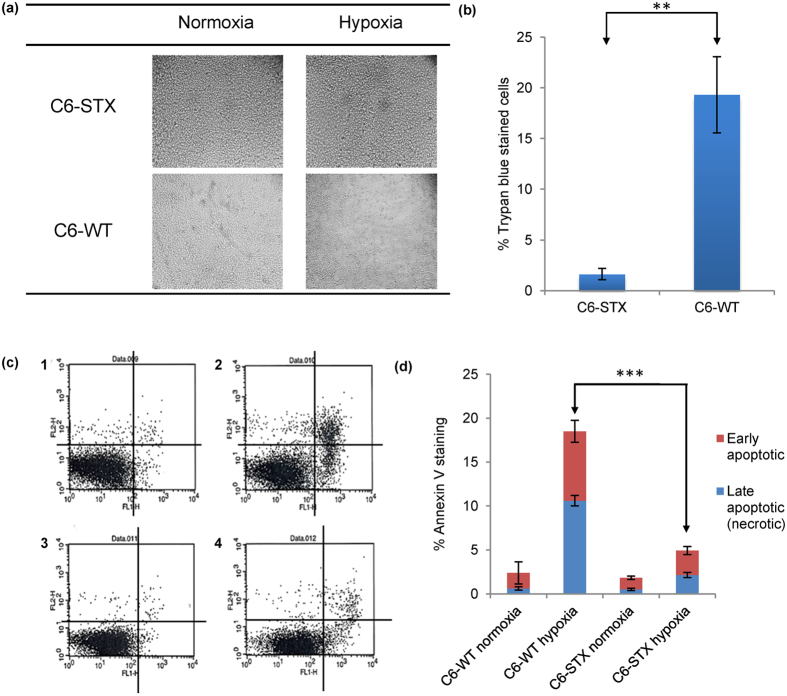
Figure 3. Effect of polySia expression on the survival of cancer cells in hypoxia.
(a) Morphological change in C6-STX and C6-WT cells after incubation under hypoxic or normoxic conditions for 96 h; (b) Trypan blue exclusion assay, showing the effect of hypoxia on the viability of C6 cells. The graph represents the mean of three independent experiments; (c) Flow cytometry analysis of C6-STX and C6-WT cells apoptosis under hypoxic and normoxic conditions after 96 h. The x-axis shows levels of annexin V cellular staining whereas levels of propidium iodide staining are shown on the y-axis; lower left quadrant of dot plots 1–4: live cells (annexin V-negative, propidium iodide-negative); lower right quadrant: early apoptotic cells (annexin V-positive, propidium iodide-negative); upper right quadrant: late apoptotic or necrotic cells (annexin V-positive, propidium iodide-positive); upper left quadrant: mechanically damaged cells (annexin V-negative, propidium iodide-positive). C1 represents C6-WT in normoxia, C2 represents C6-WT cells in hypoxia, C3 represents C6-STX cells in normoxia, C4 represents C6-STX cells in hypoxia; (d) Percentage of annexin V staining of cell lines under each condition. (**P ≤ 0.01; ***P ≤ 0.001).

