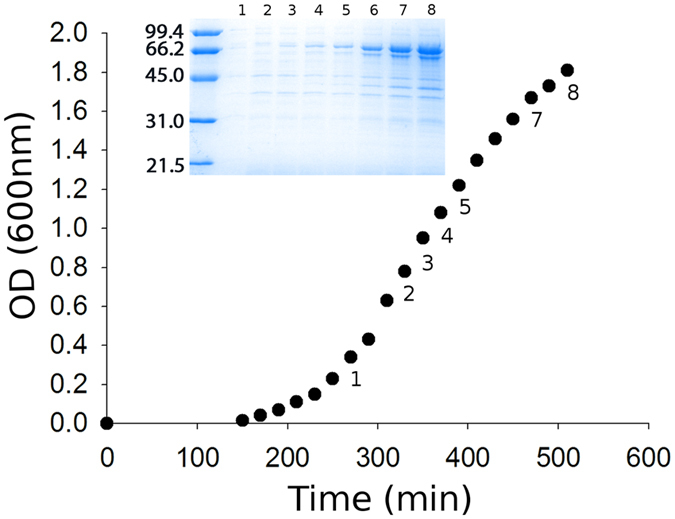
Figure 1. Autoinduction phenomenon during growth.

Culture growth was monitored by optical density measurements at 600 nm (OD60 nm). Culture aliquots were analyzed during growth by SDS-PAGE to detect recombinant hHsp70 expression. A number on both the SDS-PAGE and the expression curve indicates which samples were chosen for the SDS-PAGE shown in the figure. The molecular weight markers are indicated on the left hand side of the gel in kDa (insert).
