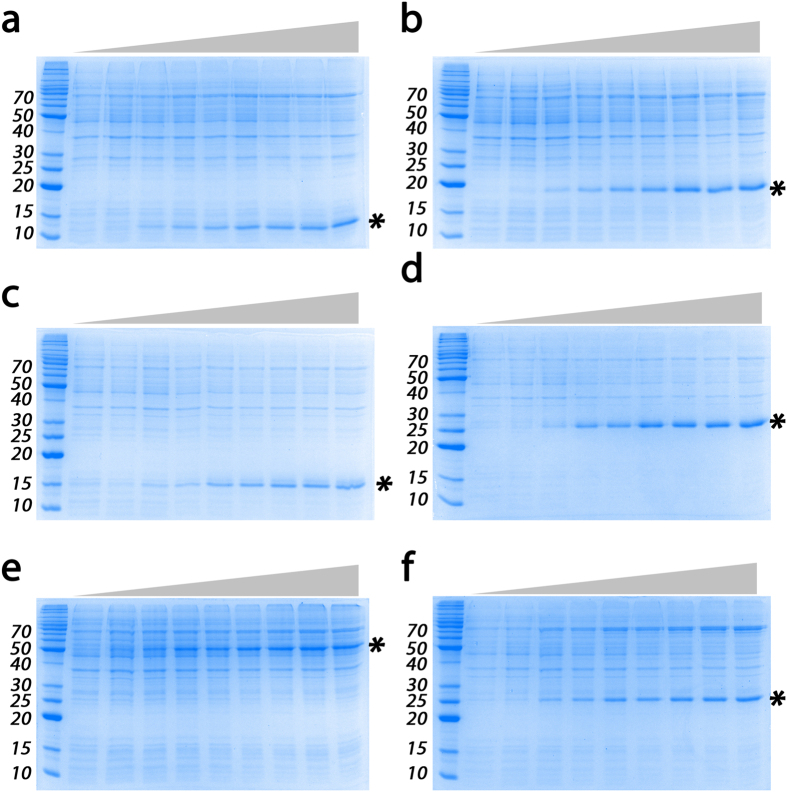
Figure 4. Autoinduction of recombinant proteins in SILEX.
The expression levels of the 6 tested proteins are shown by SDS-PAGE in the panel: (a), E. coli Trx1, (b) Richardella dulcifica MCL, (c) Xanthomonas campestris MsrB, (d) E. coli PNP, (e) H. sapiens T1R1, and (f) H. sapiens GSTA1. The culture time is schematically represented on the top of the gel. The star indicates the recombinant protein. The recombinant protein is always autoinduced around an OD600nm value of 1.0 as indicated in Table 1. The molecular weight markers are indicated on the left of the gels in kDa.

