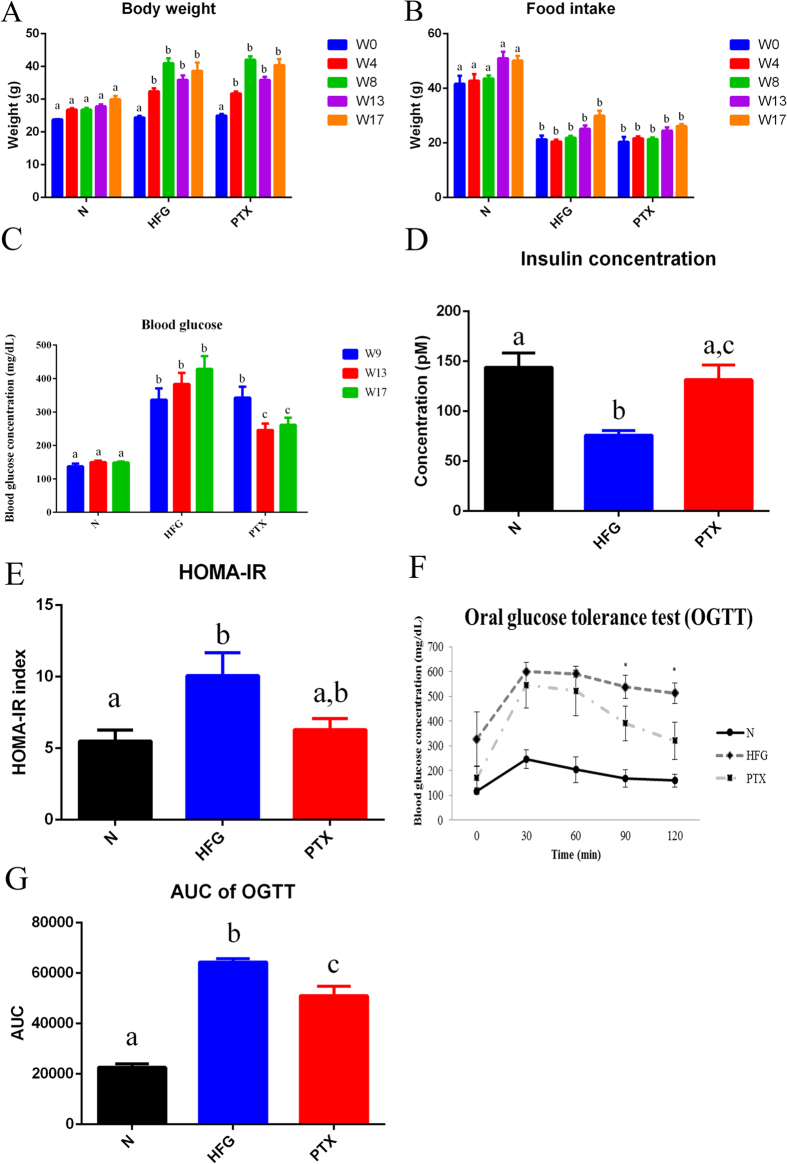
Figure 1. Physiological assessments of mice with combined NAFLD and T2D.
The figure shows (A) body weight, (B) food intake, (C) blood-glucose levels, (D) insulin concentration, (E) homoeostasis model assessment-insulin resistance (HOMA-IR) index, (F) oral glucose-tolerance test (OGTT) results, and (G) area under the curve of OGTT of the normal group (N), HFD plus hyperglycaemia group (HFG), and PTX-treatment group (PTX). Values are presented as means ± SEM (N = 8); various letters indicate significant differences (P < 0.05).

