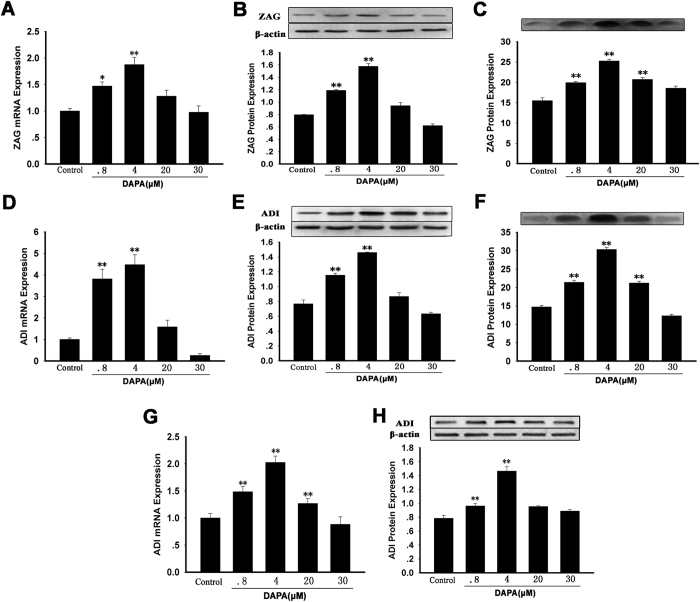
Figure 4. DAPA regulated of ZAG and ADI expression and secretion in 3T3-L1 adipocytes and HepG2 cells.
HepG2 cells were treated with 0.1% DMSO or DAPA at various concentrations (0.8, 4, 20, 30 μM) for 24 hr. Quantitative RT-PCR and Western blot were performed for the measurement of mRNA and protein. (A,B) ZAG mRNA (A) and protein (B) expression in HepG2 cell lysate. (C) ZAG protein levels in HepG2 culture medium. (D,E) ADI mRNA (D) and protein (E) expression in HepG2 cell lysate. (F) ADI protein levels in HepG2 culture medium. (F,G) ADI mRNA (G) and protein (F) expression in 3T3-L1 adipocytes lysate. DAPA, dapaglifozin; ZAG, zinc-α2-glycoprotein; ADI, adiponectin. The results represent three separate experiments performed in duplicates as means ± SEM. *P < 0.05, **P < 0.01 vs. controls.

