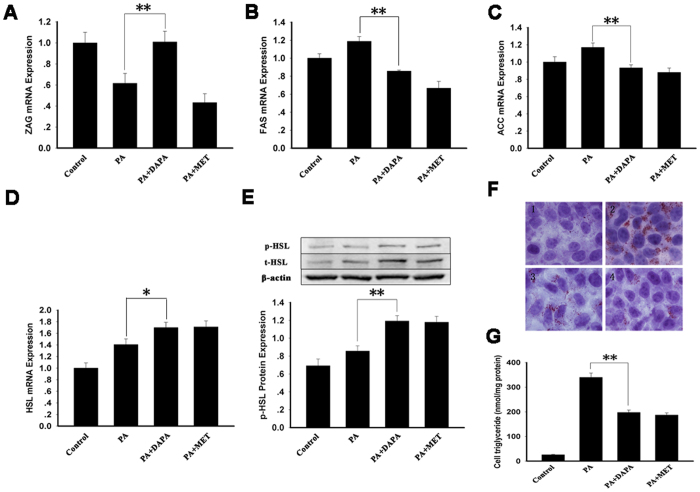
Figure 5. Effects of DAPA on gene expression related fat metabolism and lipid accumulations in HepG2 cells.
Cells were starved in serum-free medium containing 0.5% bovine serum albumin (BSA) for 12 h, and then treated with 300 μM PA with or without 4 μM DAPA/100 μM metformin, a positive control, for 24 h. Cell lysates were collected for the mRNA, protein or TG content assay. (A) ZAG mRNA expression. (B) FAS mRNA expression. (C) ACC mRNA expression. (D) HSL mRNA expression. (E) HSL phosphorylation. (F) Oil Red O staining of HepG2 cells from different treatments. (G) TG content. 1, control; 2, PA treatment; 3, PA + DAPA treatment; 4, PA + MET treatment. DAPA, dapaglifozin; PA, palmitic acid; ZAG, zinc-α2- glycoprotein; MET, metformin; ACC, Acetyl-CoA Carboxylase; FAS, fatty acid synthase; HSL, hormone sensitive lipase. The results represent three separate experiments performed in duplicates as means ± SEM. *P < 0.05, **P < 0.01.

