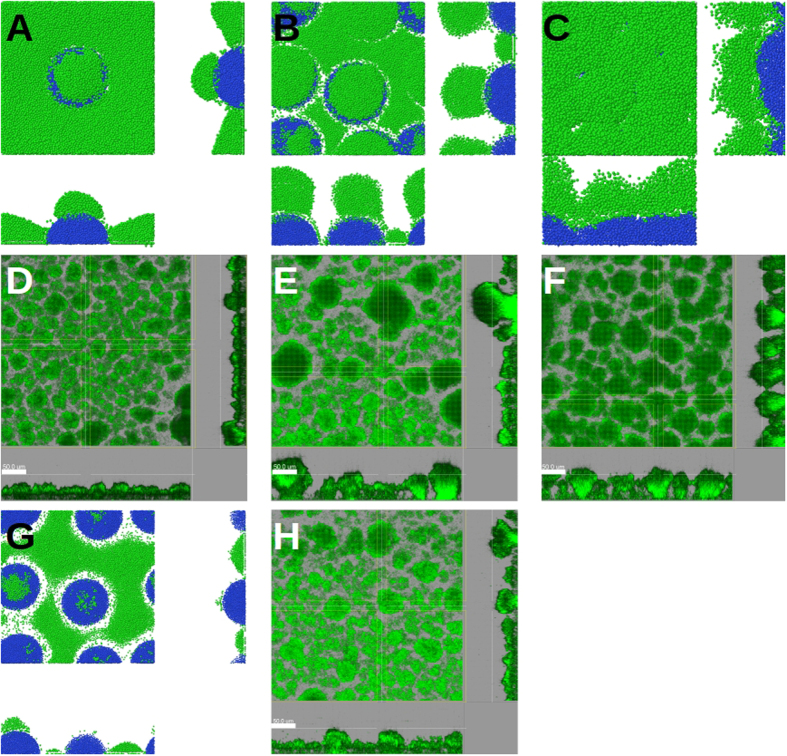
Figure 7. Biofilm fate influenced by host environmental factors.
Snapshots of simulated biofilms formed by (A) low, (B) intermediate and (C) high (0.69, 2.8 and 6.9 × 10⁻⁴ μm−2, respectively) number density of initial inoculations, and bulk nutrient concentration of 0.2 mM. CLSM micrographs of 3-day-old P. aeruginosa biofilms, initiated with inocula with optical densities of (D) 0.0001, (E) 0.005 and (F) 0.05. (G) A snapshot of the same simulated biofilm as in panel B, but under low (0.1 mM) bulk nutrient concentrations. (H) CLSM micrograph of the same 3-day-old P. aeruginosa biofilms as in panel E, but under low nutrient conditions. In A, B, C and G blue and green colours represent the immotile and motile cells, respectively. In D, E, F and H the biofilms are visualized via a constitutively expressed GFP. The size of the simulation box is 120 μm. The bars represent 50 μm. The central images show the top (x-y) view; x-z and y-z sections are shown at the bottom and right-hand side of the images.

