Figure 5.

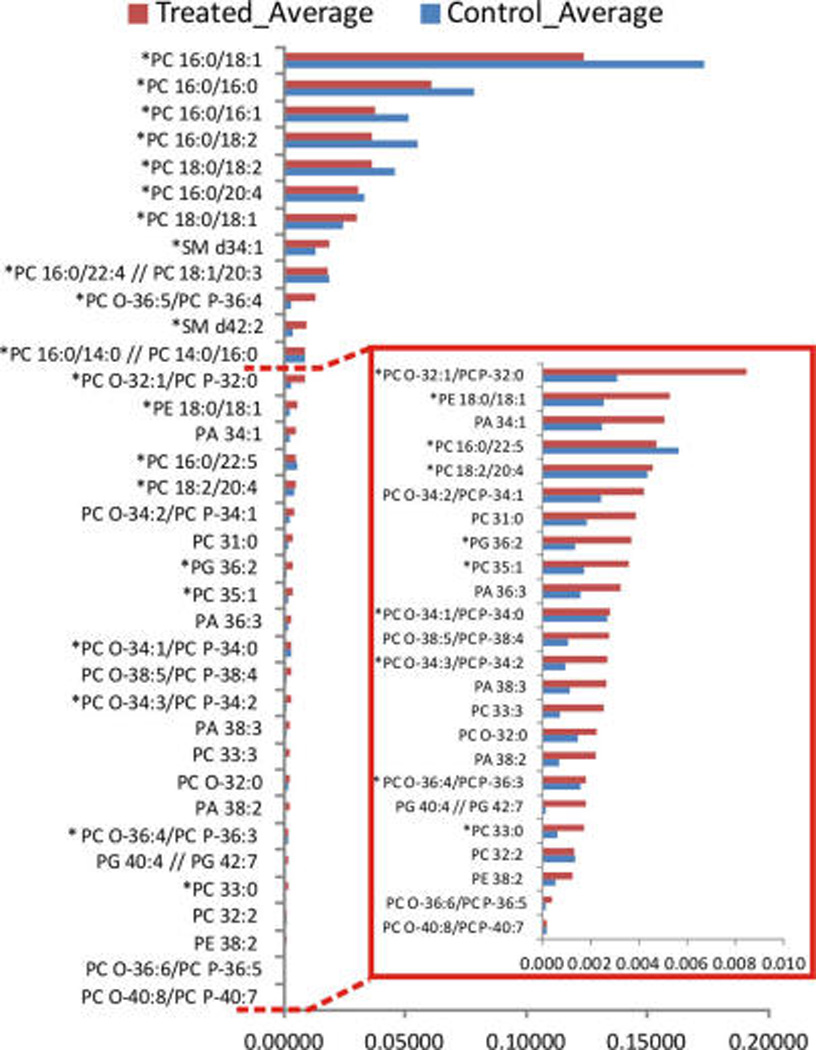
Lipid species experiencing the largest changes in intensity between treated and control samples, n = 10. Asterisks highlight those species whose presence was confirmed by LC/MS.

Lipid species experiencing the largest changes in intensity between treated and control samples, n = 10. Asterisks highlight those species whose presence was confirmed by LC/MS.