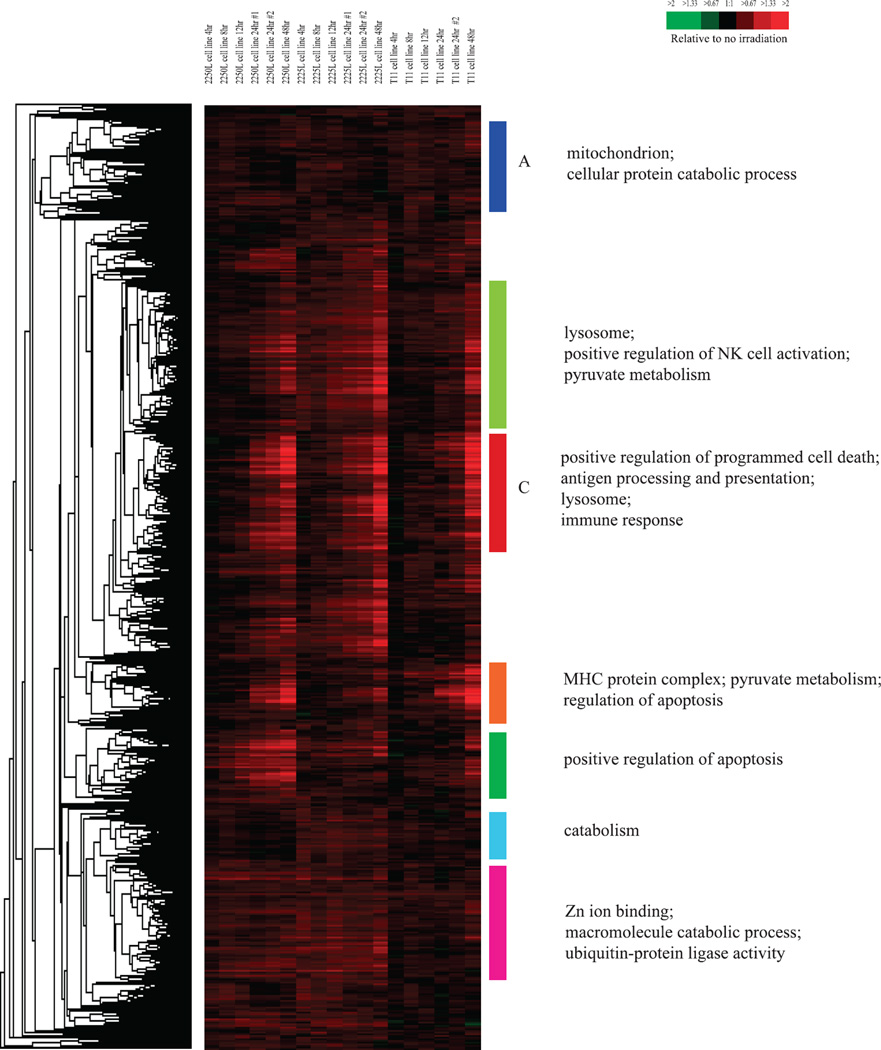
FIG. 1.
Hierarchical clustering analysis of genes determined by one-class significance analysis of microarrays (SAM) to be radiation-induced (4,278 genes) when testing three different mouse mammary tumor cell lines. Colored bars and/or letters indicate various gene clusters as discussed in this article. To the left of the diagram are the gene ontology categories significantly enriched in the corresponding gene clusters indicated by the colored bars and/or letters.

