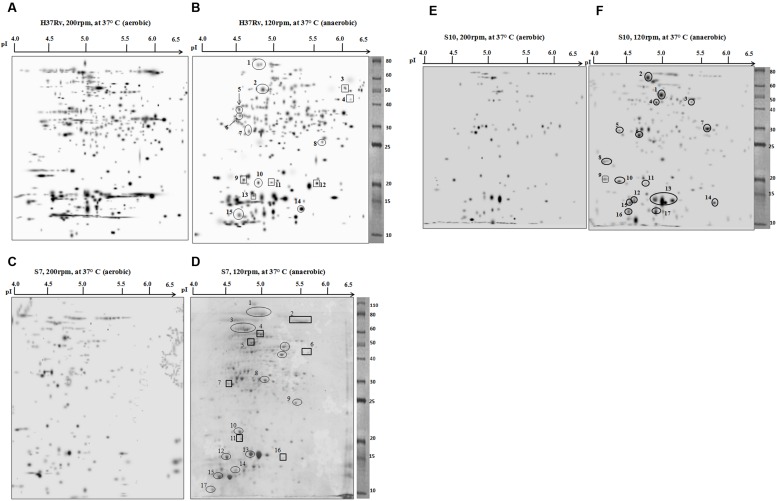
FIGURE 2.
Two-dimensional electrophoresis (2DE) gels of M. tuberculosis strain H37Rv, clinical isolates S7 and S10. Representative 2DE gel pictures, produced by PDQuest software, from the cytosolic protein fractions of each strain are given. The panels (A,C,E) show 2DE separated protein fractions of aerobic cultures of H37Rv, S7, and S10, respectively. Likewise, the panels (B,D,F) Represent 2DE separated protein fractions of anaerobic cultures of H37Rv, S7, and S10, respectively. Spot details are given in the corresponding tables. Spots that are encircled indicate overexpressed protein spots during hypoxia and spots that are boxed are newly appeared protein spots during hypoxia condition.

