FIGURE 4.
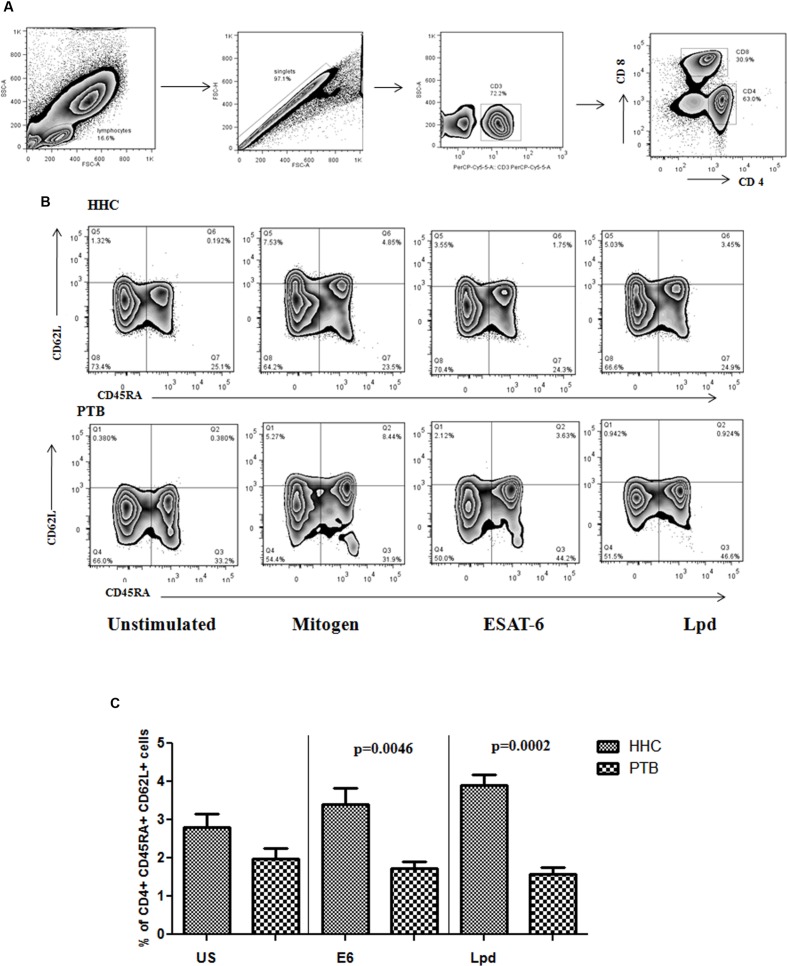
(A) General gating strategy for T cell is given. After selecting the singlets from lymphocyte population, CD3+ cells were gated followed by CD4+ cells were gated and selected for memory phenotyping. (B) CD4+ cells were analyzed for the expression of CD62L and CD45RA surface markers to define the subtypes of memory cells. Antigen specific expansion of the central memory phenotype is evident in healthy household contacts (HHC) and representative flow diagram from HHC and pulmonary TB (PTB) is given. (C) Percentage of central memory cells specific to ESAT-6 (E6) and Lpd were shown as bar graphs representing mean with SEM. p-values were calculated using the Mann–Whitney U test and value <0.05 considered as significant.

