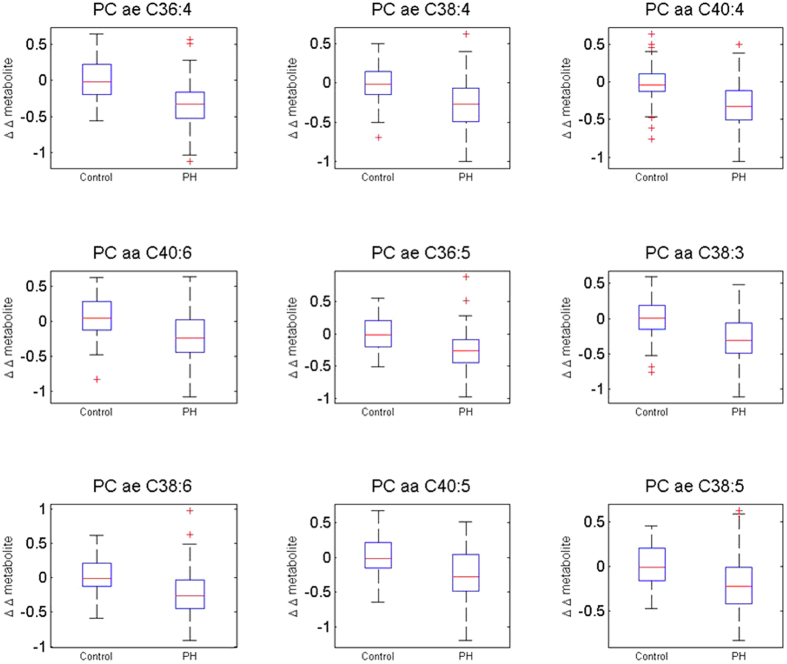
Figure 1. Box-and-Whisker plots of top 9 most differentially abundant plasma metabolites.
Boxplots display change in log2 expression from baseline to post-intervention for the Control and Perfect Health (PH) groups. Delta was calculated by log2 transformation of metabolite expression data (μM), computing the difference between post-treatment and baseline for each patient, and computing the average of that difference separately for PH and control groups. Bars display standard deviation.

