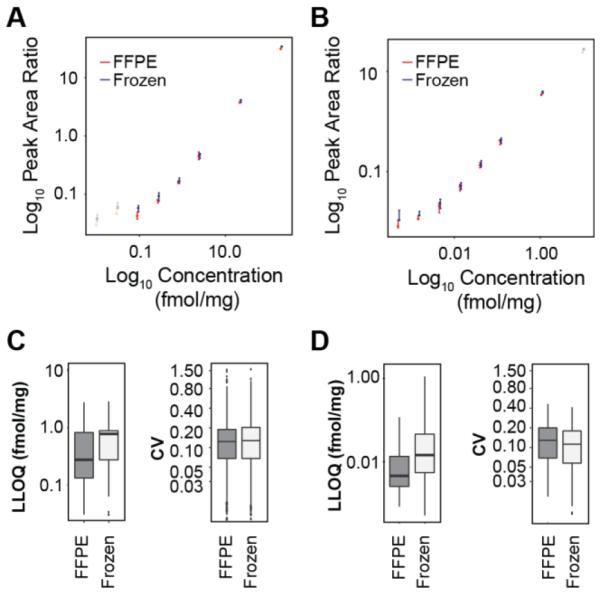
Figure 3. Characterization of assays in frozen and FFPE matrices.

LC-MRM and immuno-MRM assays were characterized by reverse response curves in frozen or FFPE tissue extracts. A. Example response curves for the peptide GLQSLPTHDPSPLQR (ERBB2) measured by LC-MRM. Responses measured in FFPE and frozen tissues are overlaid, and curves are plotted on a log10 scale. Error bars are the standard deviation of complete process triplicate measurements. B. Example response curves for the peptide GLQSLPTHDPSPLQR (ERBB2) measured by immuno-MRM. Responses measured in FFPE and frozen tissues are overlaid, and curves are plotted on a log10 scale. Error bars are the standard deviation of complete process triplicate measurements. C. Distribution of LLOQs and CVs measured in FFPE and frozen tissue for all analytes detected by LC-MRM. D. Distribution of LLOQs and CVs measured in FFPE and frozen tissues for all analytes detected by immuno-MRM. Box plots show the median (bar), inner quartiles (box), 5-95th percentiles (line), and outliers (points).
