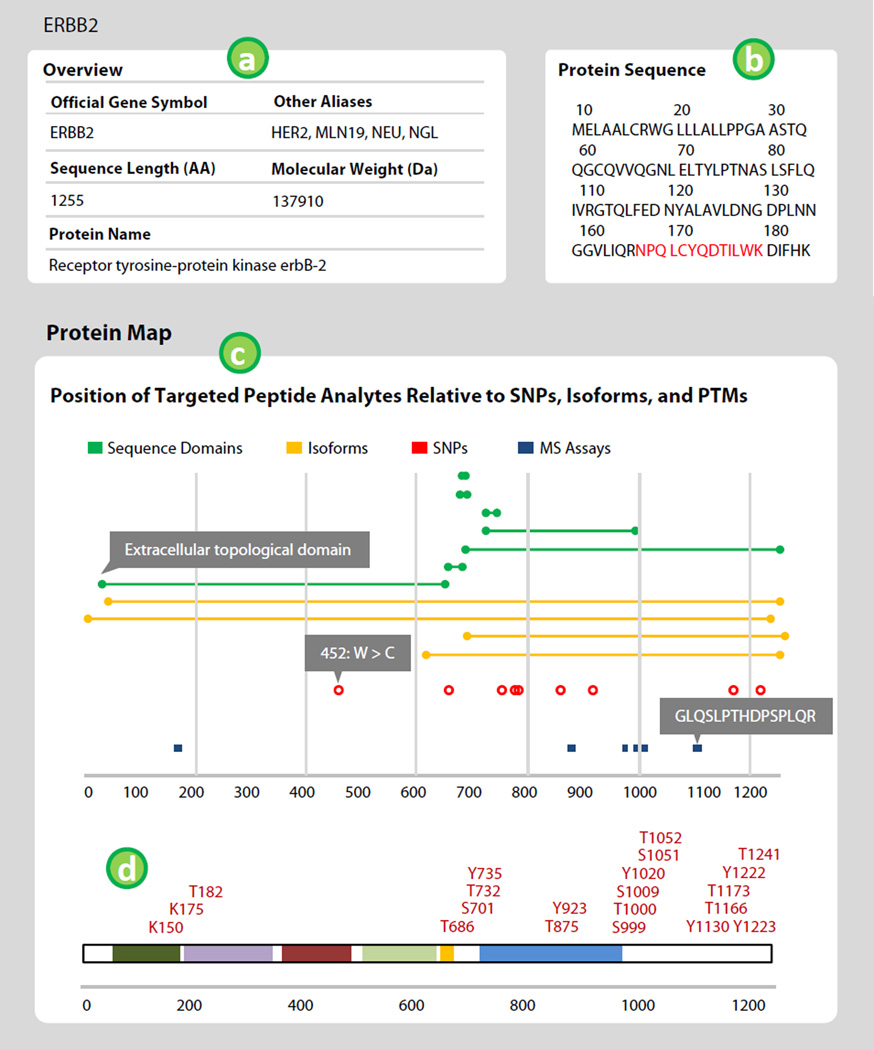
Figure 3.
The protein information panel shows information about the targeted protein. The Protein Map displays the location of available peptide assays relative to other prominent features in the protein of interest. The x-axis indicates amino acid location. Green bars indicate sequence domains, yellow isoforms, red dots single nucleotide polymorphisms, and blue lines are available peptide assays. Hovering over features displays more detail (shown in gray boxes). Post-translational modifications are mapped to the protein sequence by the PhosphositePlus database. Labels in the figure correspond to features described in the text.

