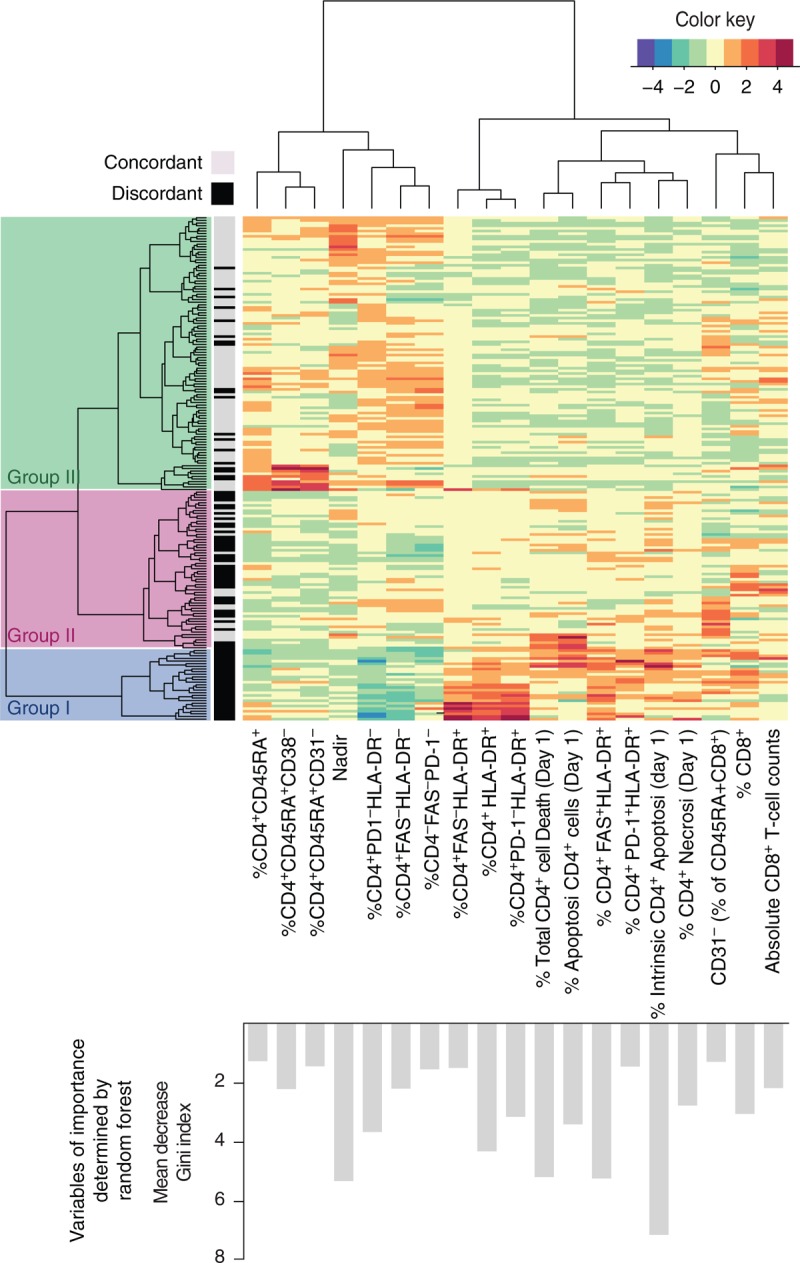
Fig. 2.
Clustering of participants according to variables of importance of the CD4+ T-cell count cutoff 400 cells/μl.

Heatmap of 191 individuals generated from activation, cell death and RTE frequency data shows one main group of immunodiscordant individuals (Group I) and a major group of intermingled immunodiscordant and immunoconcordant individuals that has been subdivided in Group II and Group III. Color key is shown in the upper right side, and Gini index for each variable is shown in the lower histogram.
