
Figure 1.
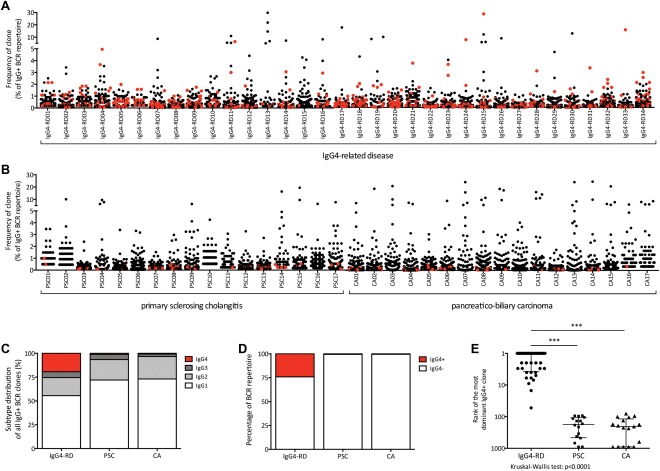
BCR repertoire in IgG4‐related disease and disease controls (A,B) scatterplot showing the IgG+ repertoires in 34 patients suffering from IgG4‐RD (IRD01‐IRD34; A) and disease controls (B), consisting of PSC (PSC01‐PSC17; n = 17) and CA (CA01‐CA17; n = 17). Every dot represents a unique IgG+ clone. IgG4+ clones are marked in red. (C) Bar chart showing the distribution of IgG1+, IgG2+, IgG3+, and IgG4‐positive clones of all IgG+ clones within the repertoire in IgG4‐RD, PSC, and CA. (D) Bar chart showing the part of the repertoire taken up by IgG4+ BCRs versus IgG4‐ BCRs in IgG4‐RD, PSC, and CA. (E) Ranks of the most dominant IgG4+ clones within the IgG+ repertoire in IgG4‐RD, PSC, and CA (P < 0.0001).