
Figure 2.
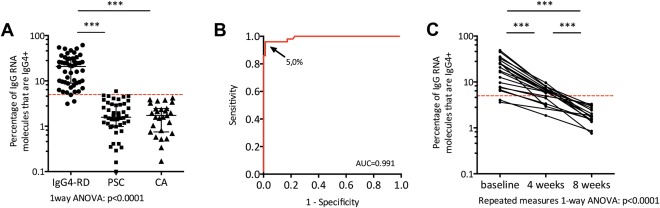
qPCR test in IgG4‐RD and disease controls (A) dot plot showing the percentage specific IgG4 RNA molecules of total IgG RNA molecules in 50 IgG4‐RD patients, 48 PSC patients, and 27 patients suffering from CA. The red dotted line delineates the cut‐off value of 5%; *** P < 0.001. (B) ROC curve of the qPCR test for the prediction of IgG4‐RD (50 cases vs. 75 controls). The arrow points to the cut‐off value and denotes this value. (C) Before‐after dot plot showing the qPCR test values in 20 IgG4‐RD patients at baseline, and 4 and 8 weeks after high‐dose corticosteroid therapy. The red dotted line delineates the cut‐off value of 5%; *** P < 0.001.