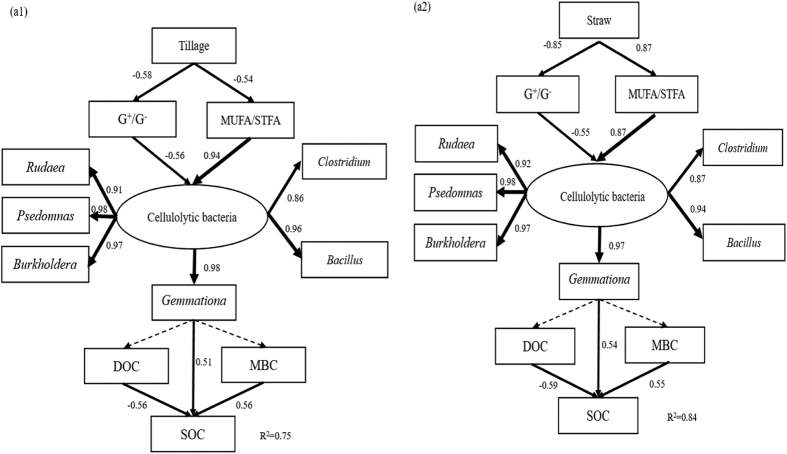
Figure 5. Structural equation model relating tillage systems, straw systems and bacteria communities to SOC (a1, χ2 = 124.867, df = 51, p = 0.525, CFI = 0.952, GFI = 0.923, RMSEA = 0.010; a2, χ2 = 114.847, df = 51, p = 0.565, CFI = 0.962, GFI = 0.915, RMSEA = 0.001).
Rectangles represent observed variables. Arrow thickness represents the magnitude of the path coefficient. Values associated with solid arrows represent the path coefficients. Solid and dashed arrows indicate significance (P < 0.05) and non-significance (P > 0.05), respectively. Straw, straw systems; DOC, dissolved organic C; MBC, microbial biomass C; SOC, soil organic C.

