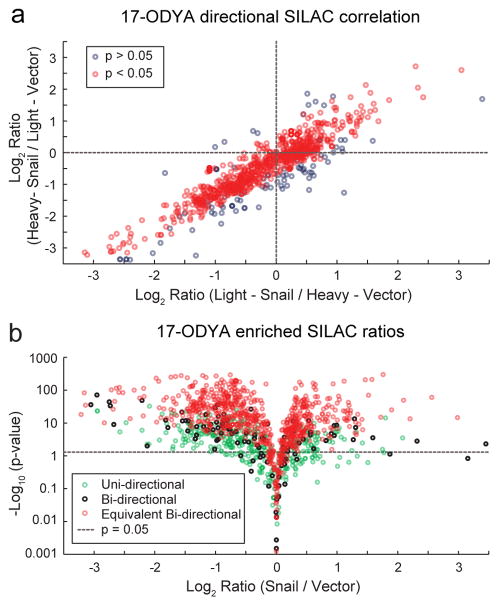
Figure 3. Quantitative S-palmitoylation profiling of Snail-expressing cells.
(a) SILAC directional correlation between inverse isotopic labeling mass spectrometry experiments comparing empty vector and Snail-transduced MCF10A cells. Following metabolic labeling and click chemistry enrichment with 17-ODYA Grey circles represent proteins that are not statistically equivalent in both SILAC labeling experiments, while red circles represent equivalent bi-directional SILAC ratios (p < 0.05). (b) 17-ODYA enriched mass spectrometry profiling of Snail-transduced cells reveals widespread statistically significant changes in protein palmitoylation enrichment. Uni-directional proteins (green circles) were identified in only one SILAC direction, while bi-directional proteins were identified in both directions (black circles) and are statistically equivalent (red circles).

