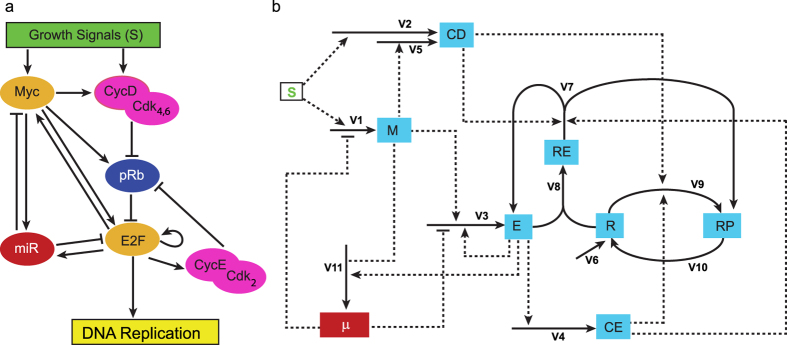
Figure 2. The network of the R model.
(a) Schematic diagram of Rb-E2F network. Arrows depict activation or upregulation; hammerheads mean inhibition or downregulation. miR refers to some members of the miR-17-92 microRNA cluster. Gene names are the same as in Fig. 1.(b) Detailed network of the R model showing the model variables (boxes) and reaction steps (solid arrows). The labels of the solid arrows correspond to the reaction rates in Eqs (1 and 2) (Methods). Dashed lines indicate which variables affect the reaction rate. The degradation steps for all the nodes in the network are not shown in the diagram but are considered in the kinetic equations (Methods). Abbreviations: M = c-Myc, E = E2F family of transcription factors (E2F1, E2F2 and E2F3), CD = cyclin D, CE = cyclin E, R = retinoblastoma protein (pRb), RP = phosphorylated pRb, RE = pRb-E2F complex, μ = miR-17-92 cluster, S = growth signals.

