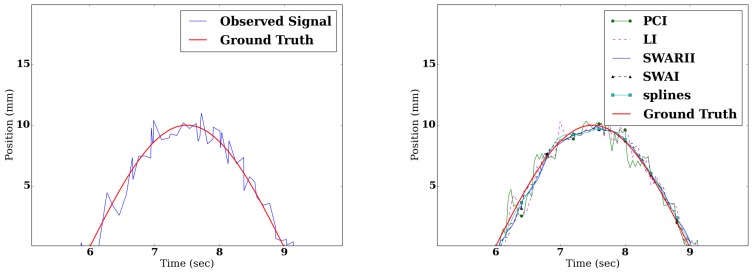
Figure 3.
Left: comparison between the real sinusoidal signal (plain red) and observed signal (plain blue) detailed on a change of direction. Right: comparison between the reconstructed signals with Piecewise Constant Interpolation (PCI) (green dot), Linear Interpolation (LI) (dashed purple), SWAI (black triangle), SWARII (plain blue) and Cubic splines (cyan square).

