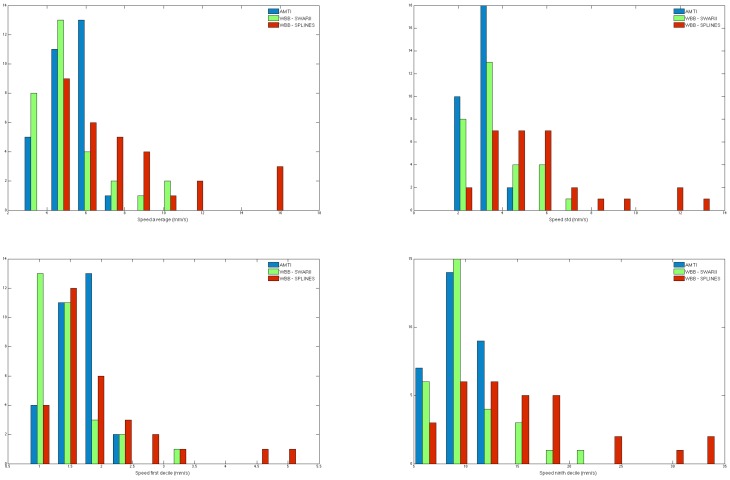
Figure 6.
Comparison of the empirical distributions of scalar features using the AMTI platform (blue), using the WBB with Cubic Splines (red), and using the WBB with SWARII (green), for the average speed (top left), standard deviation (top right), first decile (bottom left), ninth decile (bottom right).

