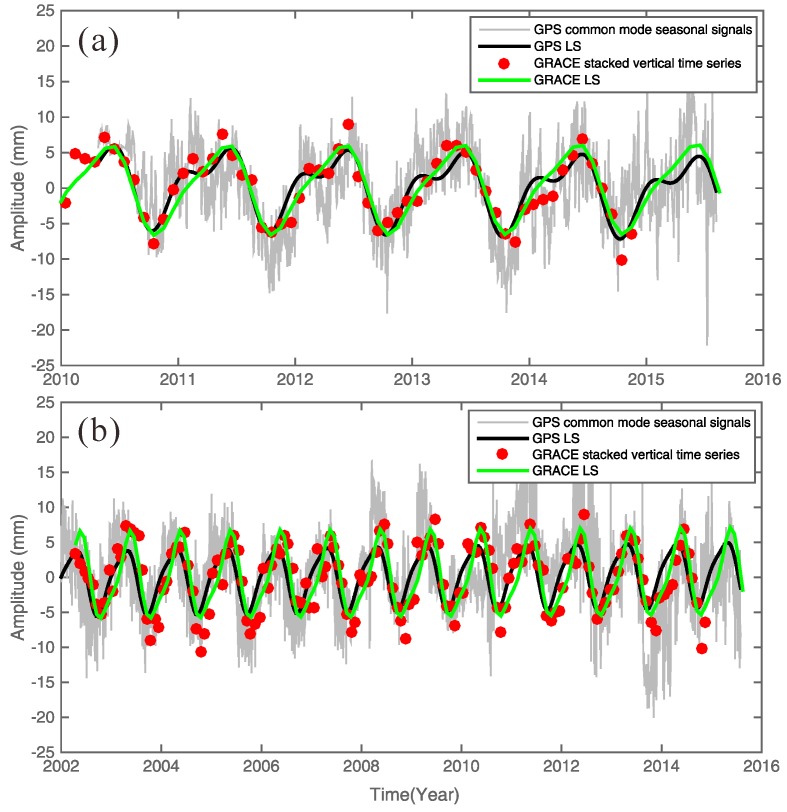
Figure 5.
The first common mode from the EOF corresponding to the seasonal signals based on (a) the records from 2010 to 2015 of 38 GPS stations, and (b) the three CGPS sites records are from 1999 to 2015. In order to compare with GRACE data (data records from 2002 to 2015), we just selected GPS data from 2002 to 2015. GRACE monthly measurements span from April 2002 to November 2014. Gray lines (daily solutions) and red dots (monthly solutions) correspond to the GPS and GRACE results, which are LS fitted by the expression in Equation (2) (i.e., the black and green lines, respectively).

