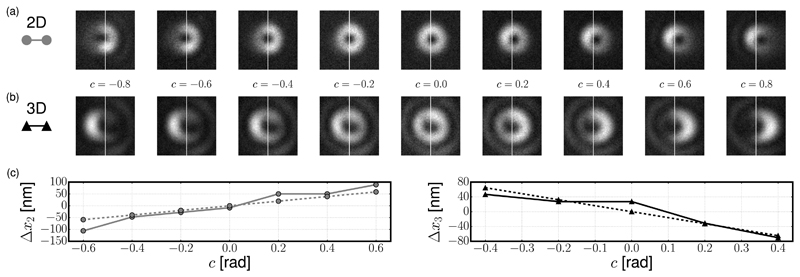
Fig. 1.
(a) xy cross sections of the 2D depletion focus measured by scanning a 150 nm gold bead for different values of the coma aberration c. The white vertical bars mark the center of each image (1.55 μm × 1.55 μm). (b) xy cross sections of the 3D depletion focus. Each image uses a different color map to enhance the contrast. (c) Shifts Δx2 (left) and Δx3 (right). Solid lines: shifts estimated from the data in (a) and (b). Dashed lines: shifts calculated using Eqs. (10) and (15).

