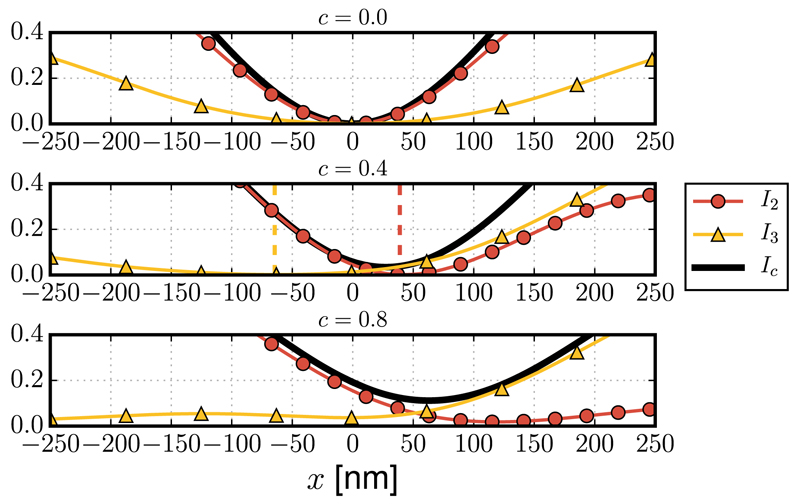
Fig. 2.
Effect of coma aberration c on the normalized intensity cross sections of the 2D (I2), 3D (I3), and combined (Ic) depletion foci. Each curve, obtained by numerically evaluating the integrals in Eq. (1), is normalized to the maximum of Ic when c = 0. For c = 0.4, the vertical dashed bars denote the shifts Δx2 = 39 nm and Δx3 = −65 nm, according to Eqs. (10) and (15). The relative shift is 103 nm. For c = 0.8, I3 does not exhibit a well-defined zero.

