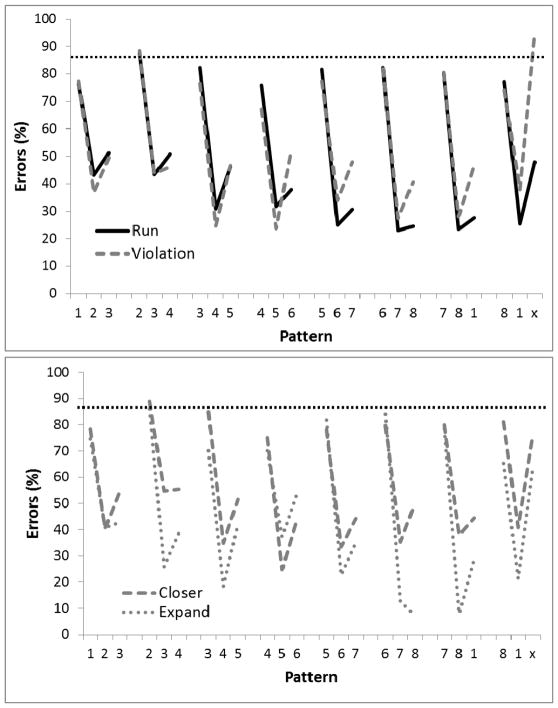
Figure 9.
Mean percentage of error rates for Experiment 2, Phase 1 where the circles were either presented closer together or further apart, grouped by Run vs Violation (top panel) and by Transformation (bottom panel). Digits on the abscissa indicate the correct circles for successive trials of the pattern. The terminal elements (indicated by ‘x’) were the only trials in which the Run and Violation patterns differed. The ‘x’ represents Circle 2 for Run group and Circle 8 for the Violation group. The horizontal dotted line indicates chance performance (87.5%).

