
Figure 4.
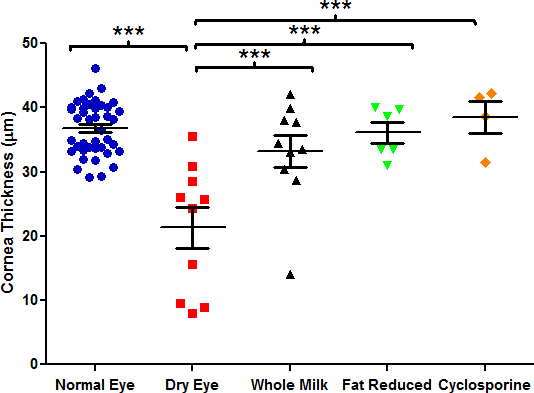
Corneal epithelial thickness after treatment with human milk therapies. Comparisons were analyzed with one-way ANOVA with Tukey’s post-hoc test. *p<0.05, **p<0.01, ***p<0.001; data are mean ± standard error of the mean (SEM).
Official websites use .gov
A
.gov website belongs to an official
government organization in the United States.
Secure .gov websites use HTTPS
A lock (
) or https:// means you've safely
connected to the .gov website. Share sensitive
information only on official, secure websites.
Corneal epithelial thickness after treatment with human milk therapies. Comparisons were analyzed with one-way ANOVA with Tukey’s post-hoc test. *p<0.05, **p<0.01, ***p<0.001; data are mean ± standard error of the mean (SEM).