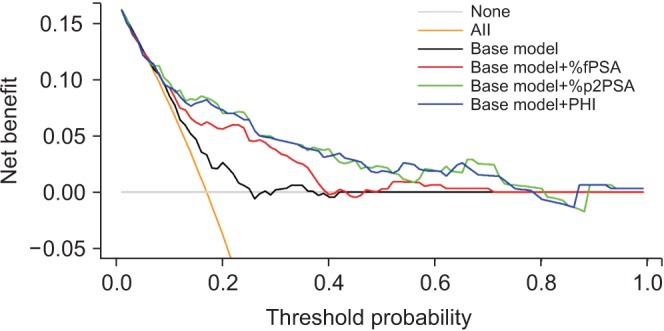
Fig. 2. Decision curve analysis for prediction of prostate cancer diagnosis, comparing base model, base model+%free-to-total PSA (%fPSA), base model+percentage of [-2]pro-prostate-specific antigen (%p2PSA), and base model+Prostate Health Index (PHI). Base model included age, total PSA, and status of initial/repeated biopsy. X-axis (threshold probability) is the probability of prostate cancer diagnosis that the patient would opt for prostate biopsy. Y-axis is the net clinical benefit for different models.

