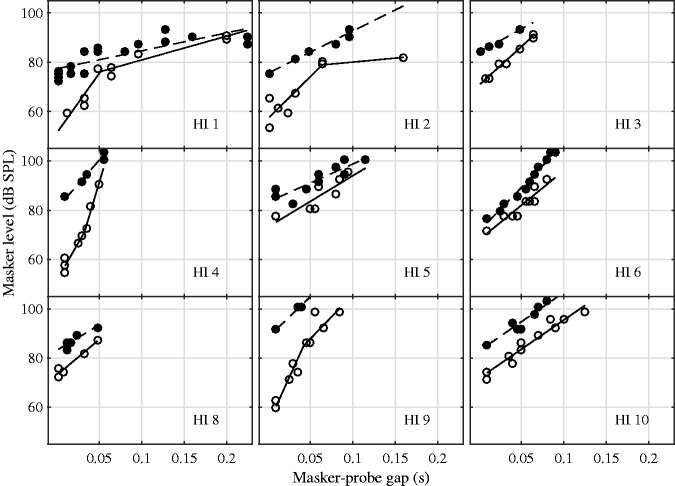
Figure 4.
Temporal masking curves (TMCs) for nine HI listeners (HI 7 not measured), together with the corresponding fits. The on- and off-frequency thresholds are depicted with open and filled circles, respectively. The fits to the on-frequency data are shown with a solid line while the single-section fits to the off-frequency data are shown with a dashed line.

