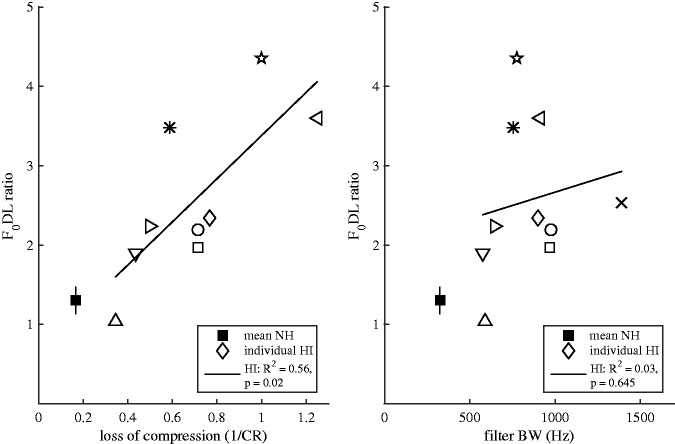
Figure 6.
Mean F0DL ratios for the two unresolved conditions (at F0s of 100 and 125 Hz) as a function of the estimated loss of cochlear compression (left panel) and filter bandwidth (right panel). Solid symbols depict the mean results for the nine NH listeners that measured both SP and RP conditions. The open symbols (same symbols as in Figure 1) depict the individual results for HI listeners. Error bars depict the standard error of the mean. The correlations were carried out only across the data for the HI listeners.

