Figure 1.

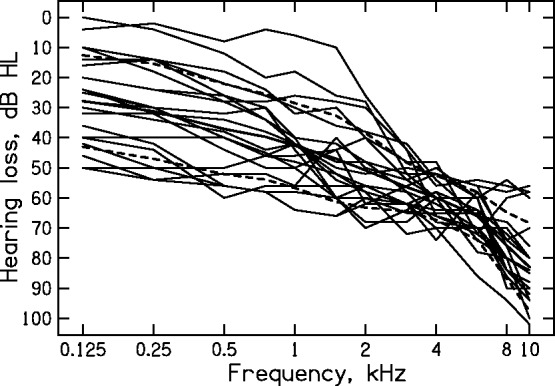
Individual audiograms (thin lines) of the test ears of the subjects. The thick line shows the mean audiogram, and the dashed lines show ± one standard deviation (SD) around the mean.

Individual audiograms (thin lines) of the test ears of the subjects. The thick line shows the mean audiogram, and the dashed lines show ± one standard deviation (SD) around the mean.