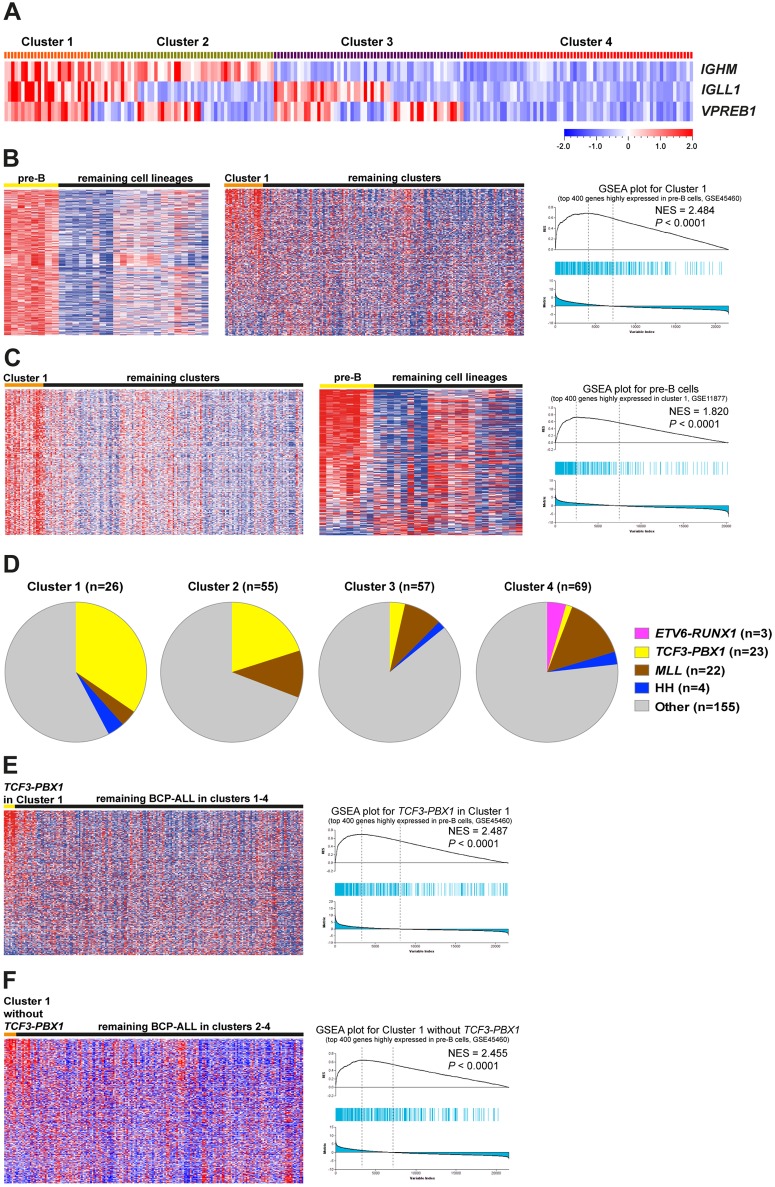
Fig 5. GSEA reveals molecular signature similarities between the IGHM+IGLL1+VPREB1+ BCP-ALL and normal pre-B cells.
(A) The BCP-ALL in data set GSE11877, including 207 high-risk patient samples, were classified into four clusters according the expression levels of IGHM, IGLL1 and VPREB1: IGHM+IGLL1+VPREB1+ (Cluster 1), IGHM+IGLL1+/-VPREB1+/- (not including IGHM+IGLL1+VPREB1+) (Cluster 2), IGHM-IGLL1+/-VPREB1+/- (not including IGHM-IGLL1-VPREB1-) (Cluster 3) and IGHM-IGLL1-VPREB1- (Cluster 4). (B) Genes highly expressed in pre-B cells are enriched in Cluster 1. Left: The pre-B signature was identified using supervised comparison in data set GSE45460. Middle: Heat map of the pre-B signature in Cluster 1 and the remaining ALL. Right: Enrichment plot shows the enrichment of pre-B signature in the Cluster 1. (C) Genes highly expressed in Cluster 1 are enriched in pre-B cells. Left: The top 400 genes highly expressed in Cluster 1 (Cluster 1 signature) were identified using supervised comparison. Middle: Heat map of the Cluster 1 signature in healthy pre-B cells. Right: Enrichment plot shows the enrichment of Cluster 1 signature in healthy pre-B cells. (D) Pie-chart shows the distribution of genetic subtypes in clusters 1–4. (E) Genes highly expressed in pre-B cells are enriched in the TCF3-PBX1 ALL from Cluster 1 but not that from other clusters. Left: Heat map of the pre-B signature in the TCF3-PBX1 ALL from Cluster1. Right: Enrichment plot shows the enrichment of pre-B signature in the TCF3-PBX1 ALL from Cluster 1. (F) Genes highly expressed in pre-B cells are enriched in Cluster 1 without TCF3-PBX1. Left: Heat map of the pre-B signature in the Cluster1 without TCF3-PBX1. Right: Enrichment plot shows the enrichment of pre-B signature in Cluster 1 without the TCF3-PBX1 ALL.

