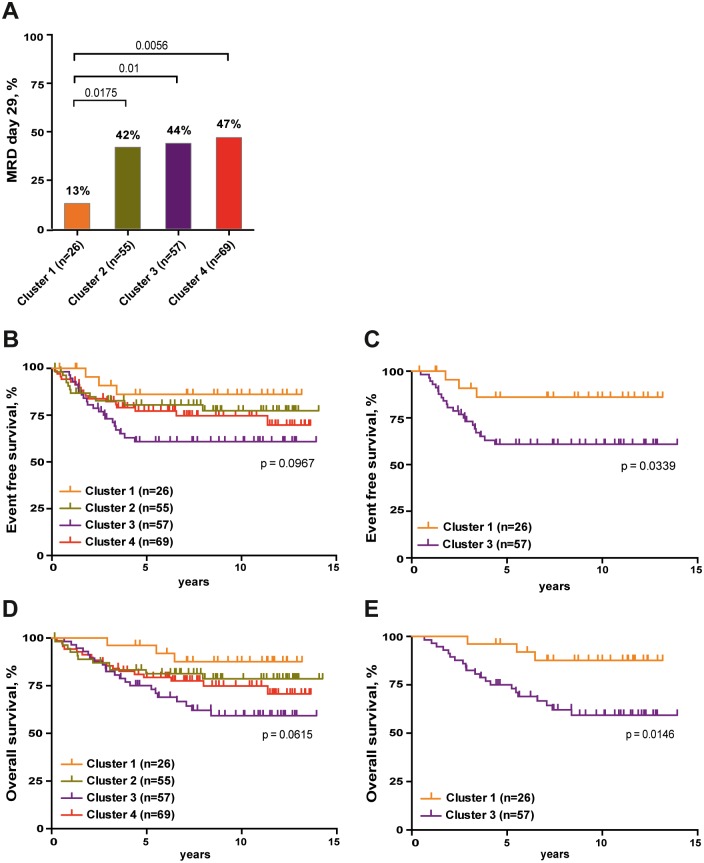
Fig 6. The expression pattern of pre-BCR components associates with the clinical outcomes in high-risk patient group.
(A) The percentage of MRD 29 positive patients was compared among clusters 1–4 using Fisher's exact test. MRD 29: minimal residual disease at day 29. (B-E) The Kaplan-Meier Log rank Survival analysis was performed to compare event free survival (B and C) and overall survival (D and E) of the 207 high-risk patients. Survival probabilities between patients within different clusters (1–4) are shown.

