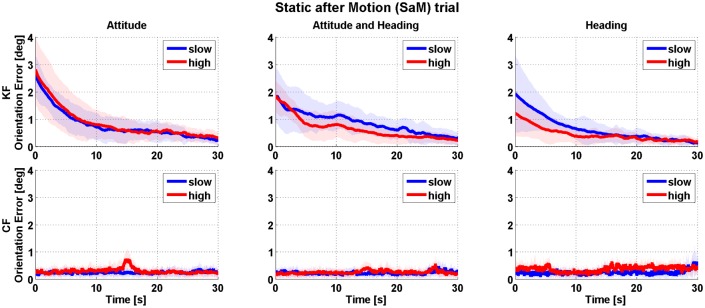
Fig 3. Results for the static after motion (SaM) trial: the solid line represents the median of the orientation error (i.e. the distance from the estimate at convergence) and its associated inter quartile range (colored shadow).
Graphs are organized according to the type of trial, heading), the sensor fusion algorithm selected (KF or CF) and the type of dynamic movement considered (slow and fast).

